Table of Contents
Bolidozor data outputs
Data produced by detection stations are sent to the main data server running a JS9browser tool, which enables to view the visual portion of the data. Statistical data are available on Bolidozor RealTime web.
There are several types of files among the data records:
- Periodic previews (XXXXX_snap.fits)
- Computed spectral previews of meteors (XXXX_met.FITS)
- Raw ADC sample records from receiver (XXXX_raws.fits)
- Metadata records (XXX.csv)
JS9 web viewer enables viewing only the first two types of records. A specialised application is required to see the rest of the records. The description of how the data files are sorted can be found at directory convenctions webpage. All the time records are stored either as Unix time or UTC.
Records generation
The records are generated by a software running on detection stations. Majority of data are produced by Radio-observer software. Other auxiliary meta-data outputs are generated by a software maintaining an integrity of data flow from the stations.
Spectral records description
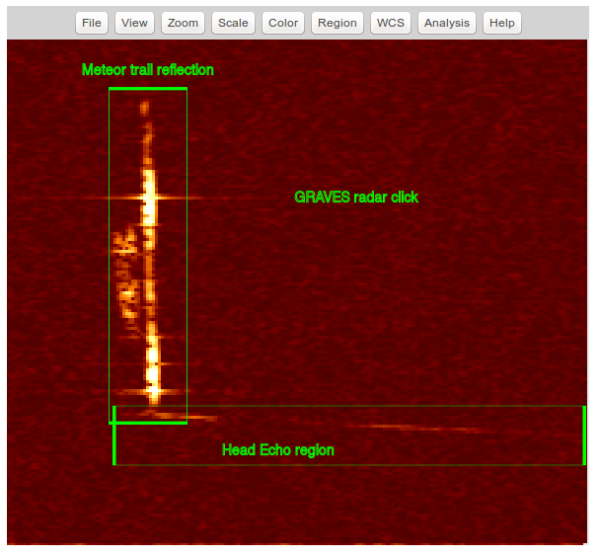
Visual records, viewable by JS9browser, have a form of so-called spectrograms, showing frequency on one and time on the other axis.
In our case:
- Vertical axis shows the time (oldest data being at the bottom)
- Horizontal axis shows the frequency (lowest frequency on the left)
The radar emitting frequency corresponds to the vertical line intersected with the average positions of the meteor trails. This signal is static and thus has almost entirely zero Doppler shift.
The lower portion of the record shows a head-echo - a signal, always beginning at higher frequencies than the meteor trail. Head-echo is a signal formed by the reflection from an ionised plasma at the front of the meteor during its fly-by. It is a moving object whose signal (due to a considerable speed - up to tens of km/s) has a large doppler shift that passes through zero (at the point of the shortest sum of distances transmitter → meteor → receiver). Some meteors lack a head-echo signal as a geometry of their fly-by does not allow reflection towards the receiver station. On the other side, other meteors have a head-echo extending even behind the point of the zero doppler shift.
Following the area of a head-echo signal there is an area of a static reflection from the meteor trail. Its intensity varies in time. The change in intensity is caused by a progressive recombination of a plasma trail of the meteor and periodic changes in intensity are caused by a spatial modulation of the radar signal.
FITS header content
SIMPLE  =                    T / file does conform to FITS standard
BITPIX  =                  -32 / number of bits per data pixel
NAXIS   =                    2 / number of data axes
NAXIS1  =                    2 / length of data axis 1
NAXIS2  =               460800 / length of data axis 2
EXTEND  =                    T / FITS dataset may contain extensions
ORIGIN  = 'SVAKOV-R12'
DATE    = '2017-09-23T05:00:57' / system time of file creation (filled in by FITS library)
DATE-OBS= '2017-09-23T05:00:47' / time of observing the event derived from sampling
CTYPE2  = 'TIME    '           / in seconds
CRPIX2  =                    1
CRVAL2  =        1506142847730 / time of first sample derived from sampling
CDELT2  =           0.01041667 / time difference between two IQ samples in ms
CTYPE1  = 'CHAN    '           / in Hz
CRPIX1  =                   1.
CRVAL1  =                    0
CDELT1  =                    1
END
